

WASHINGTON, DC (November 13, 2023) – AAA projects 55.4 million travelers will head 50 miles or more from home over the Thanksgiving holiday travel period*. This year’s Thanksgiving forecast is an increase of 2.3% over last year and marks the third-highest Thanksgiving forecast since AAA began tracking holiday travel in 2000. The top two years were 2005 and 2019, respectively.
“For many Americans, Thanksgiving and travel go hand in hand, and this holiday, we expect more people on the roads, skies, and seas compared to 2022,” said Paula Twidale, Senior Vice President of AAA Travel. “Travel demand has been strong all year, and AAA’s Thanksgiving forecast reflects that continued desire to get away and spend time with loved ones.”
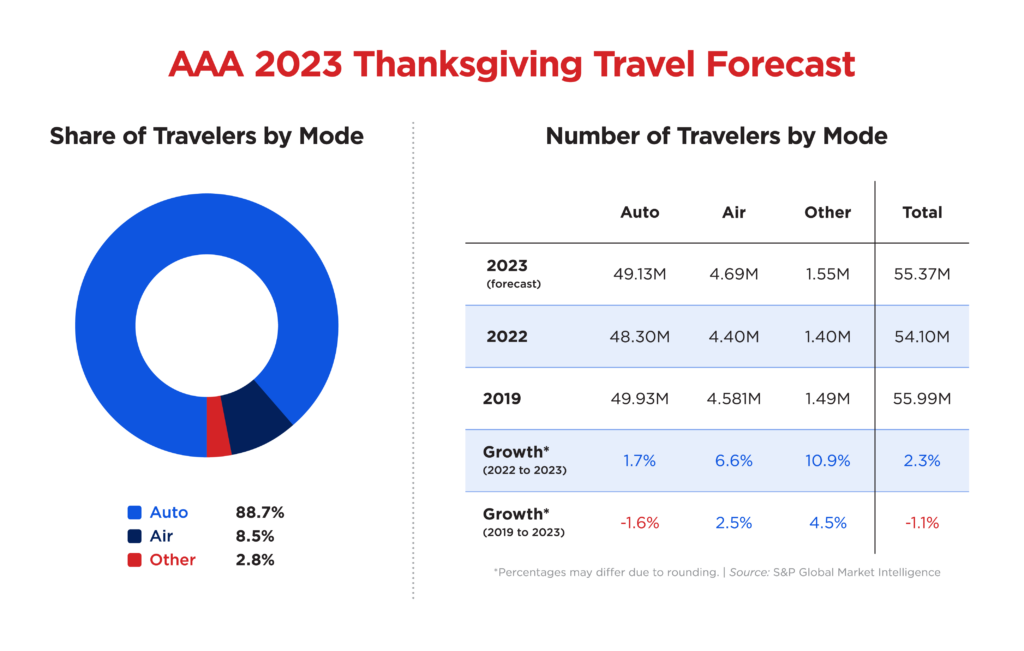 Most Thanksgiving travelers will drive to their destinations. AAA projects 49.1 million Americans will get behind the wheel, an increase of 1.7% compared to 2022. Drivers could be paying less for gas than last Thanksgiving when the national average was $3.58. This year, the national average peaked in mid-August at $3.87 and has been coming down since, despite global tensions causing ripples through the oil market.
AAA expects 4.7 million people will fly over Thanksgiving, an increase of 6.6% compared to 2022 and the highest number of Thanksgiving air travelers since 2005. Tuesday and Wednesday before Thanksgiving are the busiest air travel days ahead of the holiday and the most expensive. While Sunday is typically the busiest day to return home, AAA data shows Monday is also a popular day to fly back after Thanksgiving.
The number of people traveling by cruise, bus, and train over Thanksgiving is up nearly 11% over last year. AAA expects 1.55 million travelers will head out of town using these other modes of transportation, which took a huge hit during the pandemic but have rebounded nicely. “The cruise industry, in particular, has made a remarkable comeback,” Twidale added. “Thanksgiving cruises are mostly sold out, with many travelers looking to spend the holiday at sea.”
Best/Worst Times to Drive and Peak Congestion by Metro
INRIX, a provider of transportation data and insights, expects Wednesday, November 22, to be the busiest day on the roads during the Thanksgiving holiday travel period, with average travel times as high as 80% over normal in some metro areas. INRIX recommends leaving in the morning or after 6 p.m. to avoid the heaviest holiday congestion.
“The day before Thanksgiving is notoriously one of the most congested days on our roadways. Travelers should be prepared for long delays, especially in and around major metros,” said Bob Pishue, transportation analyst at INRIX. “Knowing when and where congestion will build can help minimize holiday traffic frustrations. We advise drivers to use traffic apps, local DOT notifications, and 511 services for real-time updates.”
Please note – the times listed below are for the time zone the metro is located in. For example, Atlanta routes = ET and Los Angeles routes = PT.
Overall Busiest Day to Drive |
|||||||
Date |
Time |
Compared to Typical |
|||||
Wednesday, Nov 22 |
2:00 – 6:00 PM |
11.44% |
|||||
Best and Worst Times to Drive |
|||||||
Date |
Worst Travel Time |
Best Travel Time |
|||||
Wednesday, Nov22 |
2:00 – 6:00 PM |
Before 11:00 AM |
|||||
Thursday, Nov 23 |
11:00 AM – 3:00 PM |
Before 10:00 AM, After 5:00 PM |
|||||
Friday, Nov 24 |
12:00 – 4:00 PM |
Before 11:00 AM, After 7:00 PM |
|||||
Saturday, Nov 25 |
3:00 – 5:00 PM |
Before 12:00 PM |
|||||
Sunday, Nov 26 |
3:00 – 5:00 PM |
Before 12:00 PM |
|||||
Peak Congestion by Metro |
|||||||
Metro |
Route |
Peak Congestion Period |
Est. Travel Time |
Compared to Typical |
|||
Atlanta |
Birmingham to Atlanta via I-20 E |
Friday, 5:00 PM |
4 hours 2 minutes |
54% |
|||
Boston |
Boston to Hyannis via Pilgrim Hwy S |
Thursday, 3:30 PM |
1 hour 58 minutes |
54% |
|||
Chicago |
Chicago to Milwaukee via I-94 W |
Wednesday, 4:00 PM |
2 hours 1 minute |
18% |
|||
Denver |
Fort Collins to Denver via I-25 S |
Friday, 5:45 PM |
1 hour 37 minutes |
27% |
|||
Detroit |
Detroit to Grand Rapids via I-96 W |
Wednesday, 2:15 PM |
3 hours 8 minutes |
35% |
|||
Houston |
San Antonio to Houston via I-10 E |
Sunday, 4:45 PM |
4 hours 2 minutes |
38% |
|||
Los Angeles |
Los Angeles to Bakersfield via I-5 N |
Wednesday, 4:30 PM |
2 hours 59 minutes |
88% |
|||
Minneapolis |
Rochester to Minneapolis via US-52 E |
Friday, 5:30 PM |
1 hour 56 minutes |
15% |
|||
New York |
Jersey Shore to New York vis Garden St Parkway N |
Sunday, 11:15 AM |
1 hour 51 minutes |
64% |
|||
Portland |
Cannon Beach to Portland via Sunset Highway E |
Sunday, 2:45 PM |
1 hour 59 minutes |
36% |
|||
San Diego |
Palm Springs to San Diego via I-15 S |
Sunday, 4:45 PM |
2 hours 39 minutes |
24% |
|||
San Francisco |
Monterey to San Franciso via Santa Cruz Hwy N |
Sunday, 7:00 PM |
3 hours 10 minutes |
63% |
|||
Seattle |
Seattle to Bellingham via I-5 N |
Wednesday, 3:30 PM |
2 hours 39 minutes |
71% |
|||
Tampa |
Tampa to Orlando via I-4 E |
Thursday, 8:15 AM |
1 hour 55 minutes |
36% |
|||
Washington, DC |
Washington, DC to Baltimore via Balt/Wash Pkwy N |
Wednesday,2:00 PM |
1 hour 13 minutes |
71% |
|||
| SOURCE: INRIX | |||||||
Holiday Booking Prices
This holiday season, travelers are generally paying less for domestic trips compared to last year and more for international vacations. The one exception is airfare, which is slightly more expensive for domestic flights this season and a bit lower for international flights. Here’s a breakdown of average booking prices for November and December, according to AAA data.
FLIGHTS
- The average price for a domestic flight is $681, up 5% from 2022.
- The average price for an international flight is $1,231, down 5.7% from last year.
HOTELS
- The average price for a domestic hotel stay is $598, down 12% from 2022.
- The average price for an international hotel stay is $772, up 5% from last year.
RENTAL CARS
- The average price for a domestic rental car reservation is $590, down 20% from 2022.
- The average price for an international rental car reservation is $696, up 9% from last year.
CRUISES
- The average price for a domestic cruise is $1,507, down 12% compared to 2022.
- The average price for an international cruise is $2,902, up 24% from last year.
TOURS
- The average price for a domestic tour is $1,058, down 15% compared to 2022.
- The average price for an international tour is $1,208, up 21% from last year.
Top Holiday Destinations
Warm weather destinations, theme parks, tourist attractions, historic sites, and cruise port cities top the list of domestic and international destinations this holiday season.
| DOMESTIC | INTERNATIONAL |
| Orlando, FL | Cancun, Mexico |
| Fort Lauderdale, FL | Mexico City, Mexico |
| Miami, FL | Punta Cana, Dominican Republic |
| Anaheim, CA | Bahrain |
| Tampa, FL | Rome, Italy |
| New York City, NY | Montego Bay, Jamaica |
| Las Vegas, NV | Nassau, Bahamas |
| Honolulu, HI | Bali & Papua New Guinea |
| Maui, HI | Paris, France |
| San Diego, CA | London, England |
Holiday Forecast Methodology
Travel Forecast
In cooperation with AAA, S&P Global Market Intelligence developed a unique methodology to forecast actual domestic travel volumes. The economic variables used to forecast travel for the current holiday are leveraged from S&P Global Market Intelligence’s proprietary databases. These data include macroeconomic drivers such as employment, output, household net worth, asset prices including stock indices, interest rates, housing market indicators, and variables related to travel and tourism including gasoline prices, airline travel, and hotel stays. AAA and S&P Global Market Intelligence have quantified holiday travel volumes going back to 2000.
Historical travel volume estimates come from DK SHIFFLET’s TRAVEL PERFORMANCE/MonitorSM. The PERFORMANCE/MonitorSM is a comprehensive study measuring the travel behavior of U.S. residents. DK SHIFFLET contacts over 50,000 U.S. households each month to obtain detailed travel data, resulting in the unique ability to estimate visitor volume and spending, identify trends, and forecast U.S. travel behavior, all after the trips have been taken.
The travel forecast is reported in person-trips. In particular, AAA and SPGMI forecast the total U.S. holiday travel volume and expected mode of transportation. The travel forecast presented in this report was prepared the week of October 9, 2023.
*Thanksgiving Holiday Travel Period
For the purposes of this forecast, the Thanksgiving holiday travel period is defined as the five-day period from Wednesday, November 22 to Sunday, November 26.
About AAA
Started in 1902 by automotive enthusiasts who wanted to chart a path for better roads in America and advocate for safe mobility, AAA has transformed into one of North America’s largest membership organizations. Today, AAA provides roadside assistance, travel, discounts, financial and insurance services to enhance the life journey of 64 million members across North America, including 57 million in the United States. To learn more about all AAA has to offer or to become a member, visit AAA.com.
About S&P Global
S&P Global (NYSE: SPGI) provides essential intelligence. We enable governments, businesses and individuals with the right data, expertise and connected technology so that they can make decisions with conviction. From helping our customers assess new investments to guiding them through ESG and energy transition across supply chains, we unlock new opportunities, solve challenges and accelerate progress for the world. We are widely sought after by many of the world’s leading organizations to provide credit ratings, benchmarks, analytics and workflow solutions in the global capital, commodity, automotive markets. With every one of our offerings, we help the world’s leading organizations plan for tomorrow, today. For more information, visit www.spglobal.com.
About DKSA
DK SHIFFLET boasts the industry’s most complete database on U.S. resident travel both in the U.S. and worldwide. Data is collected monthly from a U.S. representative sample, adding over 60,000 traveling households annually and is used daily by leading travel organizations and their strategic planning groups. DK SHIFFLET is an MMGY Global company.
About INRIX
Founded in 2004, INRIX pioneered intelligent mobility solutions by transforming big data from connected devices and vehicles into mobility insights. This revolutionary approach enabled INRIX to become one of the leading providers of data and analytics into how people move. By empowering cities, businesses, and people with valuable insights, INRIX is helping to make the world smarter, safer, and greener. With partners and solutions spanning across the entire mobility ecosystem, INRIX is uniquely positioned at the intersection of technology and transportation – whether it’s keeping road users safe, improving traffic signal timing to reduce delay and greenhouse gasses, optimizing last mile delivery, or helping uncover market insights. Learn more at INRIX.com.